


Bitcoin is entering a pivotal week, consolidating below its all-time high of $112,000 while holding firm above the psychological $100,000 level. Despite increasing macroeconomic tensions—rising US Treasury yields, trade disputes between major economies, and growing geopolitical friction—Bitcoin has demonstrated relative strength, maintaining support above key demand zones. This resilience has fueled debate among analysts, with some anticipating a deeper correction and others forecasting a breakout into price discovery.
Market sentiment remains mixed, with volatility picking up and on-chain data showing signs of caution among retail participants. However, a potential turning point has emerged. According to top analyst Darkfost, the Hash Ribbons indicator—a tool that tracks miner stress and has historically signaled strong buy opportunities—has just flashed a new buy signal. This development is notable given that Bitcoin’s hashrate recently hit new all-time highs, reflecting growing network strength despite price consolidation.
The Hash Ribbons signal suggests that short-term miner capitulation may be over, and that long-term investors could see a favorable entry point. With BTC now coiling for a decisive move, this signal could act as a catalyst, reigniting momentum as traders watch closely for a push toward new highs in the days ahead.
Key Signal Suggests Bitcoin Is Ready To Move
Bitcoin could be on the verge of a major move as it consolidates below its all-time high of $112,000. The market remains tense, with bulls holding control but facing pressure from rising macroeconomic risks, including the ongoing bond market stress and escalating global trade tensions. If BTC fails to reclaim momentum and drops below critical demand levels, it could trigger a deeper correction. However, a breakout above $112K would likely reignite bullish sentiment across the crypto space.
Darkfost highlighted a key technical signal that’s flying under the radar—a new buy signal from the Hash Ribbons indicator. This metric assesses stress levels in the Bitcoin mining ecosystem by comparing the 30-day and 60-day moving averages of the network hashrate. When the short-term average crosses above the long-term average after a period of capitulation, it typically signals that miner sell pressure is easing and accumulation may follow.
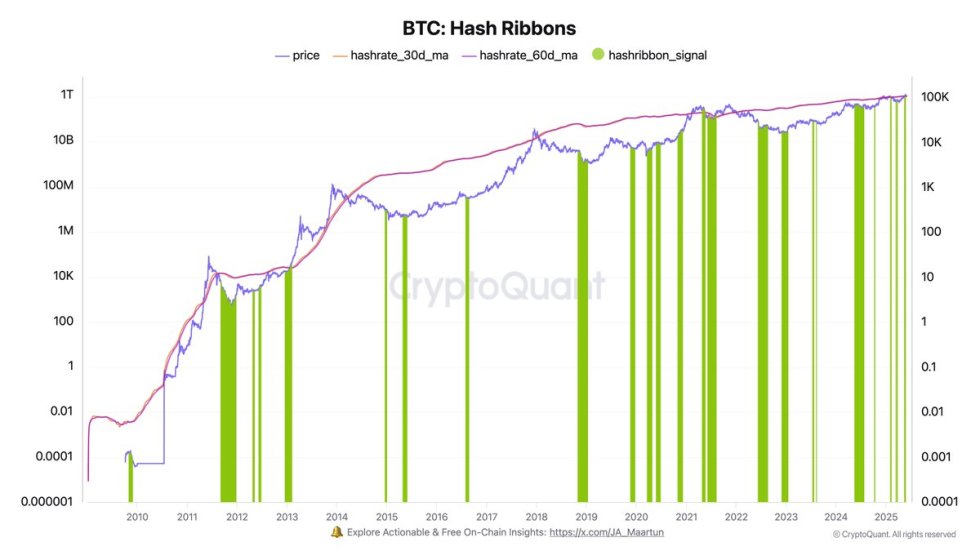
While these periods of miner stress can be short-term bearish—since some miners are forced to liquidate BTC to stay solvent—they often present high-quality entry points for long-term investors. Notably, the recent Hash Ribbons buy signal aligns with Bitcoin’s hashrate reaching new all-time highs, reflecting network resilience despite price stagnation.
If bulls take advantage of this setup, the market could see a strong push toward a new price discovery phase. But failure to hold above key support levels may open the door for a retest of the sub-$100K zone. As always, the next few sessions will be crucial in determining Bitcoin’s trajectory for the weeks ahead.
Daily Chart Analysis: Support Holds, Momentum Awaits Confirmation
Bitcoin continues to consolidate between the $103,600 support and $109,300 resistance zone, as seen on the daily chart. After reaching a new all-time high near $112,000, the price retraced and is now holding slightly above the 34-day EMA at $103,298. This moving average, alongside the $103,600 horizontal level, acts as the key demand zone bulls must defend to maintain the current bullish structure.
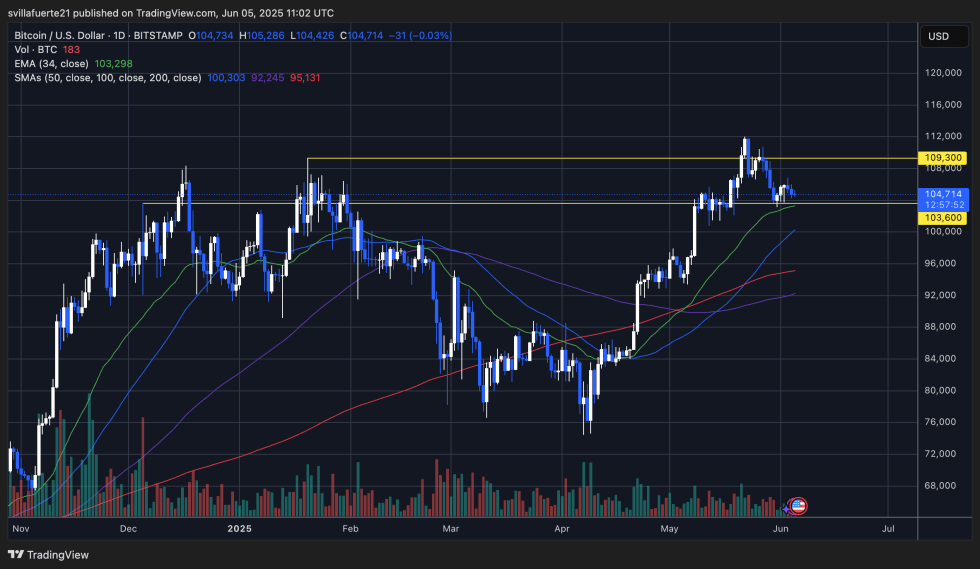
Despite the recent pullback, BTC remains in a broader uptrend, supported by higher lows since the March bottom. However, momentum is clearly fading as daily candles show lower highs and declining volume. A break above $109,300 would likely re-ignite bullish momentum and pave the way for a potential push toward new all-time highs.
On the downside, a confirmed break below $103,600 could trigger a sharper correction, with the next key support at the 100-day SMA near $92,245. Traders should watch for a daily close outside of this range to determine the next directional move.
Featured image from Dall-E, chart from TradingView

Trusted Editorial content, reviewed by leading industry experts and seasoned editors. Ad Disclosure
Bitcoin is entering a pivotal week, consolidating below its all-time high of $112,000 while holding firm above the psychological $100,000 level. Despite increasing macroeconomic tensions—rising US Treasury yields, trade disputes between major economies, and growing geopolitical friction—Bitcoin has demonstrated relative strength, maintaining support above key demand zones. This resilience has fueled debate among analysts, with some anticipating a deeper correction and others forecasting a breakout into price discovery.
Related Reading: Bitcoin On-Chain Demand Slips 2.45% As Retail Investors Stay Cautious – Details
Market sentiment remains mixed, with volatility picking up and on-chain data showing signs of caution among retail participants. However, a potential turning point has emerged. According to top analyst Darkfost, the Hash Ribbons indicator—a tool that tracks miner stress and has historically signaled strong buy opportunities—has just flashed a new buy signal. This development is notable given that Bitcoin’s hashrate recently hit new all-time highs, reflecting growing network strength despite price consolidation.
The Hash Ribbons signal suggests that short-term miner capitulation may be over, and that long-term investors could see a favorable entry point. With BTC now coiling for a decisive move, this signal could act as a catalyst, reigniting momentum as traders watch closely for a push toward new highs in the days ahead.
Key Signal Suggests Bitcoin Is Ready To Move
Bitcoin could be on the verge of a major move as it consolidates below its all-time high of $112,000. The market remains tense, with bulls holding control but facing pressure from rising macroeconomic risks, including the ongoing bond market stress and escalating global trade tensions. If BTC fails to reclaim momentum and drops below critical demand levels, it could trigger a deeper correction. However, a breakout above $112K would likely reignite bullish sentiment across the crypto space.
Darkfost highlighted a key technical signal that’s flying under the radar—a new buy signal from the Hash Ribbons indicator. This metric assesses stress levels in the Bitcoin mining ecosystem by comparing the 30-day and 60-day moving averages of the network hashrate. When the short-term average crosses above the long-term average after a period of capitulation, it typically signals that miner sell pressure is easing and accumulation may follow.
While these periods of miner stress can be short-term bearish—since some miners are forced to liquidate BTC to stay solvent—they often present high-quality entry points for long-term investors. Notably, the recent Hash Ribbons buy signal aligns with Bitcoin’s hashrate reaching new all-time highs, reflecting network resilience despite price stagnation.
If bulls take advantage of this setup, the market could see a strong push toward a new price discovery phase. But failure to hold above key support levels may open the door for a retest of the sub-$100K zone. As always, the next few sessions will be crucial in determining Bitcoin’s trajectory for the weeks ahead.
Related Reading: Bitcoin Indicator Signals Trend Exhaustion – Reset Or Reversal?
Daily Chart Analysis: Support Holds, Momentum Awaits Confirmation
Bitcoin continues to consolidate between the $103,600 support and $109,300 resistance zone, as seen on the daily chart. After reaching a new all-time high near $112,000, the price retraced and is now holding slightly above the 34-day EMA at $103,298. This moving average, alongside the $103,600 horizontal level, acts as the key demand zone bulls must defend to maintain the current bullish structure.
Despite the recent pullback, BTC remains in a broader uptrend, supported by higher lows since the March bottom. However, momentum is clearly fading as daily candles show lower highs and declining volume. A break above $109,300 would likely re-ignite bullish momentum and pave the way for a potential push toward new all-time highs.
Related Reading: Bitcoin Exchange Netflow Goes Red – 3.6K BTC Daily Outflows Signal Accumulation
On the downside, a confirmed break below $103,600 could trigger a sharper correction, with the next key support at the 100-day SMA near $92,245. Traders should watch for a daily close outside of this range to determine the next directional move.
Featured image from Dall-E, chart from TradingView
Editorial Process for bitcoinist is centered on delivering thoroughly researched, accurate, and unbiased content. We uphold strict sourcing standards, and each page undergoes diligent review by our team of top technology experts and seasoned editors. This process ensures the integrity, relevance, and value of our content for our readers.

 Bitcoin
  Ethereum
  XRP
XRP  BNB
BNB  Dogecoin
  Solana